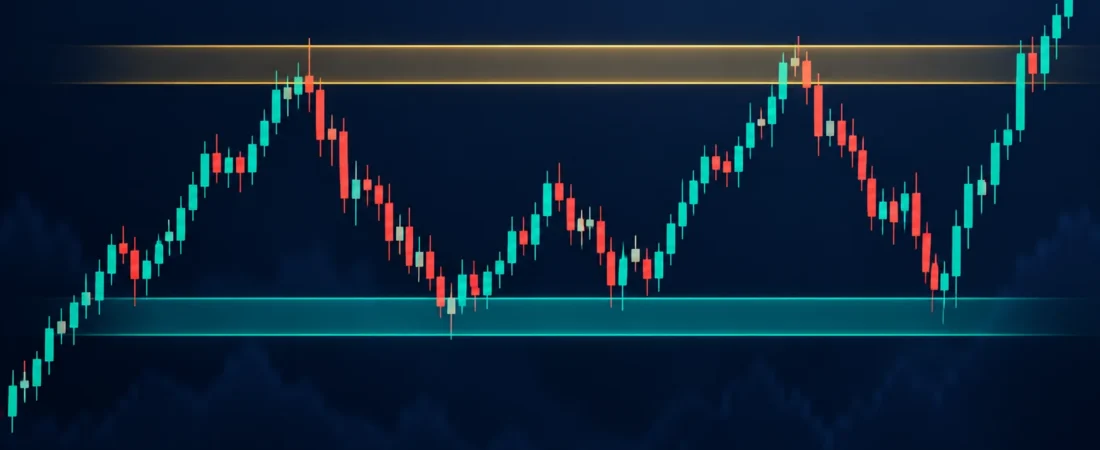
Support and resistance are areas where price has previously reacted. They can help you organize a chart, but they do not predict what the market must do next. This guide explains how to mark useful zones, how to think about a breakout, and where risk management fits in.
New to chart reading? Start with our beginner’s price-chart reading checklist to understand timeframes, candles and trend context before marking support and resistance zones.
What is support?
Support is a price area where a decline has paused or reversed before. Traders may watch it because buyers previously became more active there. Draw a zone around the cluster of reactions rather than forcing every wick to meet one exact line. A level that worked last week can fail today, so treat support as an observation, not a guarantee.
What is resistance?
Resistance is an area where advances have slowed or reversed in the past. It can show where sellers previously became more active. As with support, a zone is often more useful than a single price. Notice whether price rejects the area, pauses inside it, or closes beyond it. The surrounding trend and the size of the move matter too.
A simple way to mark zones
- Start with a higher timeframe. Find clear swing highs and lows on a daily or four-hour chart before moving to a smaller chart.
- Look for repeated reactions. Two or more visible turns in a similar area may make that zone worth watching. Avoid adding so many levels that the chart becomes unreadable.
- Use the body and wick range. Mark a practical band that includes the area where candles repeatedly reacted; do not chase perfect precision.
- Check the present context. Note whether price is trending, ranging, or moving on unusual volatility. An old level is less useful when current conditions differ sharply.
What changes after a breakout?
A move above resistance or below support may signal a change in the balance of buyers and sellers. But a brief move beyond a zone can reverse quickly. Some traders wait for a close beyond the area and then watch whether price can hold it on a retest. A former resistance zone may later act as support, and a former support zone may later act as resistance. This is a possibility to observe, not a rule that always works.
Put risk before the entry
Before considering a trade, define what would show that your idea is wrong, the amount you can afford to risk, and how a loss would affect the rest of your plan. A stop order is useful but does not promise an exact execution price in a fast market. Position size should follow the distance to your invalidation point and your risk limit, not the excitement of a breakout.
Illustrative example: If a share has repeatedly turned around a broad ₹98–₹101 area, that band may be marked as a support zone. If price closes below it, the original support idea needs reassessment. This example is hypothetical and is not a recommendation to buy or sell any security.
Three common mistakes
- Marking every minor swing as a major level.
- Assuming a zone will hold because it worked once before.
- Entering a breakout without a defined invalidation point or position size.
Support and resistance are best used as part of a repeatable chart-reading process. To study chart structure in more depth, explore our Technical Analysis course in Chandigarh or browse all Traders Mantra courses.
Discuss Your Chart-Reading Learning Path
Want to study chart structure through a course? Contact Traders Mantra to discuss your experience level and confirm the current syllabus, fees and batch availability.
Call +91 88377 93811 or enquire on WhatsApp for course details.
Education and risk note: This article is for learning only. It is not personalized investment advice or a trading tip. Markets involve the risk of loss; no level or method assures a return.
Further reading: NSE Academy technical analysis course overview includes support and resistance among its core topics; Investor.gov explains investment risk.